
Product Overview
LAVIS-plus is an "IC design visualization tool" that can not only be used as a layout viewer, but also as an electrical characteristics analysis tool, a simple design checker, and simple editor.
While inheriting the greatest features of LAVIS, the ultra fast display of large-scale design data, memory saving, and high compatibility with other manufacturers' tools, LAVIS-plus meets specifications that exceed those of LAVIS in all aspects such as performance, operability, and expandability.
With LSI design data becoming larger and more detailed, it has become important to reduce time to market, and to design with yield in mind right from early stages. With LAVIS-plus, you can solve these and other problems in various processes ranging from design, verification, mask manufacture, inspection, to failure analysis.
- Supports multithread processing, thereby reducing the opening time significantly. For example, with eight parallel processing threads, the opening time for OASIS data has been reduced to up to 1/5 of that of LAVIS.
- The drawing time has also been reduced to up to 1/10 for GDS and OASIS data, enabling you to draw with less stress than ever before.
- The various performance factors that can have a large impact on reducing the TAT have been improved. For example, the memory consumption at the time data is open has been reduced to 1/2 for LEF/DEF data.
Supported Format
In addition to GDS, OASIS and LEF/DEF, MEBES, JEOL, TOSHIBA and jobdeck files are supported.
Operating Environment
ELAVIS-plus operates in the EWS environment similarly as in the PC environment.
| OS | Versioin | Architecture |
|---|---|---|
| Linux | RedHat Enterprise Linux 7, 8, 9 and OSs compatible with these versions | x86_64 (64bit) |
| Windows | Windows 10, Windows 11 Windows Server 2016, 2019 |
x86_64 (64bit) |
Main Features
Marker Function
You can draw a marker simply as you draw a rectangle, circle and other shapes using a common drawing tool. Comment can also be added.
Measurement function
In addition to the distance between vertices, sides, figures, widths, perimeters and line& spaces of a figure, you can measure parallel wiring pitches. You can also measure the section in which the distance between edges is max&min.
Search function
You can search for the specified cell, text, figure, figure property. With a LEF/DEF data, you can search for components and pins.
Overlay function
Easy step allows you to overlay and compare GDS with mask or image file such as one taken by SEM, that has different scale, rotation, mirroring and other attribute.
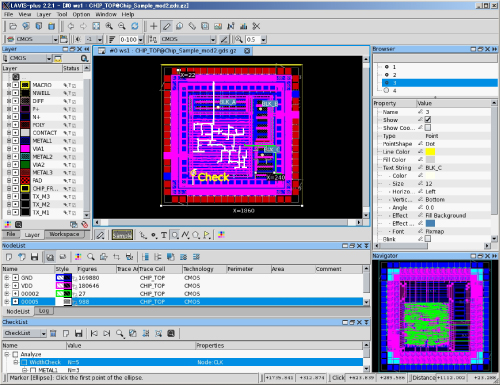
Node tracing function
After defining the connection relationships between wiring and contact layers, you can trace and highlight same-voltage nodes. You can also detect and analyze the location of electrical short, and output the traced node information.
In addition, the traced results can be saved as a database so that you can trace and display nodes much more faster (optional). Parallel processing with multi-processes allow high-speed database creation and full-chip data processing. Moreover, TEXTs of ERC/LVS can be used for net names. You can also batch process this function using lvnetextract2 utility program provided with LAVIS-plus.
Analyze function
You can calculate the wire length and resistance on a certain node. If sheet and contact resistance are defined, conventional manual calculation becomes unnecessary. You can also search for connection points having the highest resistance.
Furthermore, various rules checks, such as width of traced node, spacing between the nodes, spacing between the node and neighboring wires, and min&max width etc. are provided. Checking for the overlapping status between nodes or the nod and neighboring figure are also possible. Signal integrity-related checks such as number of vias on the trace nodes are also available.
Boolean operation
You can perform Boolean operations such as XOR, AND, OR, and SUB on an overlaid data interactively and export the results to GDS, OASIS, or LAVIS-plus-original format file. The results are displayed with distinctive colors so it is useful in checking corrected data. Optional advanced mode is also available.
Clip function
You can clip the specified area of a data and then save it to GDS, OASIS, or LAVIS-plus -original format file. You can also specify the area you want to exclude from been clipped. In addition, the flat or hierarchy option can be specified for fast clipping from a large amount of data.
DRC/LVS interface
The results of DRC/LVS executed by the third party tools can be analyzed on the LAVIS-plus screen. LAVIS-plus's high speed file loading can greatly reduce the turn around time in a large amount of data.
GDS/OASIS Simple Edit function
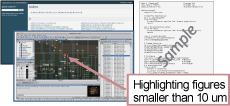
The GDS/OASIS Simple Edit function enables you to add, delete, or move an element or cell with ease. This function can be used to correct DRC error or a data after OPC, or be used for creating test data.
3D view function
3D view function can be synchronized with 2D data, or rotated to see its flip side, etc. Moreover, trace node can be displayed in 3D view and highlighted. You can draw a line on the 3D view and see its cross-sectional view in a different view.
and more...
API
 In addition to providing LAVIS's variety of interfaces with other manufacturers' tools, LAVIS-plus has released the API for facilitating its customization. The API enables you to use general syntax and libraries, so that you can easily create all sorts of scripts ranging from basic scripts, such as those for obtaining and listing figure information, to advanced ones, such as those for using such information to perform figure operations and detecting figures with specific shapes.
Basic Function
Opening/Closing files, operating menus, getting cell info (coordinates, cell name, mirroring etc.) , clipping data, getting figure info (coordinates, layer, etc.), Boolean operation (AND/OR/XOR/SUB), operating markers, measurement, search, node tracing, analyzing width/spacing/small figures in rectangle area, editing GDS/OASIS, and more.
Chip design
Checking Fan-Out (GDS/OASIS), tracing nodes in batch (GDS/OASIS), displaying clock tree with color (DEF), displaying scan chain with color (DEF), calculating load, and more.
Library design
Checking Pin location&width for LEF and GDS, estimating Pin load.
Failure analysis
Obtaining the specified net and neighboring figures, net tracing after replacing macro with GDS.
Assembly
Outputting a list of PAD coordinates, TEG location and a list of TEG PADs, adding dummy patterns.
Mask data preparation/Mask inspection/wafer processing
Clipping data, measurement, and more.